


Match Loudness
Will match your track to the perceived loudness of any commercial recording you input into Har-Bal.

Loudness Compensation
Har-Bal leaves the initial volume level unchanged even after performing spectral correction (EQ changes) thanks to its “loudness compensation” algorithm.

IntuitMatch and IntuitQ
“Eyes to the ears” is a more realistic slogan that we like. It does not mean give way to your eyes if your ears tell you everything you need.

Dynamics Processing
Unlike conventional dynamics processing, it doesn’t use attack – decay envelope extraction. The envelope it already has from the analysis. As such the gain change that tracks the music is in sync and symmetrical about the content. By that I mean with a normal compressor you would typically have a fast attack time and slow release which means that the gain quickly drops at the start of a transient and slowly rises at the tail after the transient.
Now you’ll probably think that makes no sense and will sound awful. However it doesn’t sound awful, and here is the reason why. In traditional compression we principally have fast attack and slow release because a compressor cannot predict the future so it doesn’t know when to pull down the level and if it does it slowly a very big transient will push through before it has a chance to bring it down. We have a slow release time because fast gain change will lead to a lot of distortion. Because Har-Bal knows the entire history of the track we don’t need fast attack because we know when to pull the level down. The net result is that the dynamics processing in Har-Bal works more like the volume riding technique of recording engineers of days gone past where they would adjust down the level while the music is being recorded because they knew when the loud parts were coming. This point is clearly illustrated in Figure 11, which shows the difference between envelope detection used traditionally and in Har-Bal.
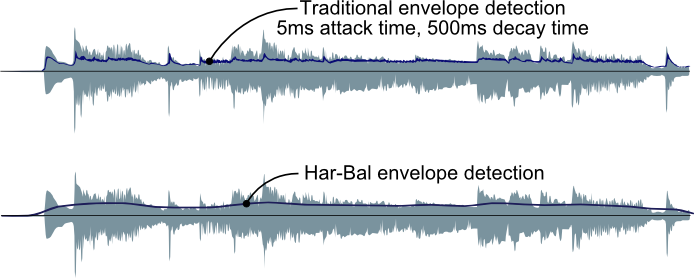
FIGURE 11: A COMPARISON OF ENVELOPE DETECTION IN TRADITIONAL AND HAR-BAL DYNAMICS PROCESSING
By using a slow moving envelope for dynamics processing we ensure that the short term transient material remains largely unaltered and we simply change the relativity between loud and soft passages of a track. This also ensures that very little distortion is introduced by dynamics processing. These two factors are responsible for the clean sound of Har-Bal’s dynamics processing.
Download a tutorial (PDF) on using the Dynamic Node Tool here.

Mid / Side Decoding
Now the basic Har-Bal 3 filter block has left and right channels being filtered by left and right filters, then being encoded into Mid and Side using the above scheme with Mid and Side filters applied to those components and then being decoded back into Left and Right.
To get back to Left and right we use the following equations:
Left = (Mid + Side) / 2
Right = (Mid – Side) / 2

The New Air Tool
The effect the new Air has on the spectrum is actually rather small when used modestly. It is realized as a log normal random deviate applied to a unity gain all pass response with the variance of the deviate tapering at higher frequencies to add warmth. Without the taper it would sound too bright. How the Air then affects spectrum then depends upon whether the peaks and troughs of the Air response line up with the peaks in the spectrum. That alignment can’t be accurately re-constructed with the analysis results because the spectrum resolution is reduced to 1/12th octave and the peaking and troughing of the deviate is finer scale than that.
Time Splitting
It’s complex selection not because the process is complex but the selected time line is patchy and discontinuous. But by selecting the time line in that manner and then controlling those errant peaks by highly selective filters that only act on the minimum amount of time required to fix the problem you end up with much better results.
Complex time selection and filtering is our take on how to control errant peaks in highly dynamic instruments such as vocal parts. The conventional approach is multiband compression, for which we have a disliking, mainly because to our mind it seems like a poor match to the problem at hand.
Har-Bal allows you to easily tidy up the sound quality of mastered or unmastered recordings while preserving the original intent of the producer and/or recording engineer.
Click here to read an interesting article about different genres of music and how Har-Bal assists in the process.
Buy Now
Har-Bal version 3.7 can be purchased through comecero by following this link.
Upgrade from version 2.3 for US$41.95, Upgrade from version 3.0 for US$12.00. Upgrade pricing is implemented through issuing of discount coupons. If you wish to upgrade then contact us for your coupon.
(Registered Users will be contacted by email with upgrade instructions)
Haven’t been contacted about the upgrade? [Click Here]
Minimum System Requirements
![]()
Microsoft Windows
XP SP3, Vista, Windows 7, 8 & Windows 10.
![]()
Apple
OS X 10.7