Tech Blog
Loudspeaker System Design – Enclosure Details and the Woofer / Midrange Crossover
Finally I’m at a point where I can start detailing the design process. The hold up has been trudging through the low frequency model and making sure it was all correct. Though I posted my model paper over a week ago it has undergone some critical revisions as I uncovered mistakes so if you happened to download it soon after I published it you should get a fresh copy so that I don’t throw you off on a dead end track. I’m confident it is all correct now.
Now knowing the background to drivers in both sealed and vented enclosures, its now time to dive and and start coming up with box parameters to go with the chosen drivers. My aim is to obtain a response down to 30Hz or better in a moderately sized box of 80 litres or less. It is possible to chose box parameters based on a given response, say Butterworth for example, but in my case, doing so would give rise to a much larger box than I’d like. For that reason it is often more effective just selecting the box parameter (box volume, box Q and box frequency) by trial and error, thereby obtaining a design that fits your objectives.
For trial and error design we need to plot the theoretical response of the mounted driver to evaluate the choice of parameters. You can buy software (or use free web based versions of the same thing such as “speaker builder”) to do the job but I find a better approach is to use the freely available and open source software “R” to do the job. The benefit of using R over other pieces of software is that I can use it and its many features to develop code that provides an optimised solution, and of course, it costs nothing and is very widely used in the scientific community. You can obtain R from CRAN.
If you would like to reproduce and reverse engineer the results I obtained you can obtain the R source code for this design phase from here. Just paste the code into the R GUI and it will reproduce the results herein.
Figure 1 shows the effect of box frequency on the response. The driver is a VIFA SLS830667 in a box of 70 litres and a box Q of 7. The blue, green and red lines correspond to box frequencies of 20Hz, 30Hz and 40Hz respectively.
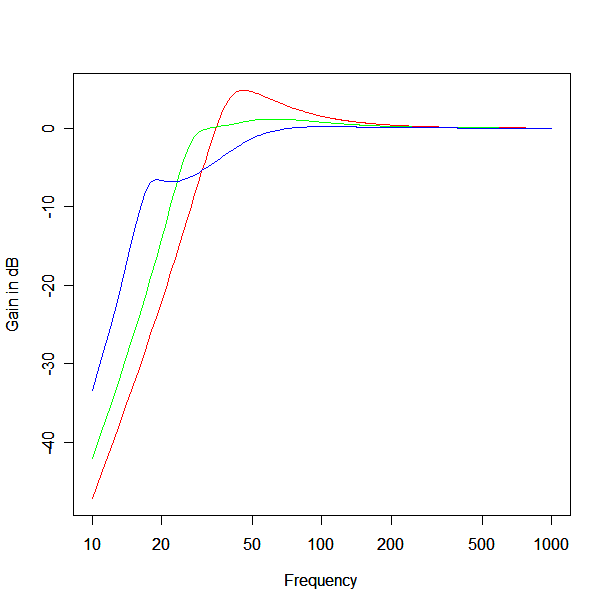
Figure 1 – Vented Box Response for Varying Box Frequency : red = 40Hz, green = 30Hz, blue = 20Hz.
When the box frequency is set too low the vent radiates ineffectively, leading to a drop in output. When the box frequency is set too high the vent radiates too well leading to a peaking response. For the box volume of 70 litres as shown the best response occurs for a box frequency of 30Hz. With this box tuning the response is about -3dB down at 26Hz! Quite a good result for a box of only 70 litres! It isn’t maximally flat, exhibiting a peak at around 62Hz of +1.17dB but this level of digression from the ideal is tolerable and as we shall see later, can be compensated for in the crossover design.
Figure 2 shows the effect of box volume on response with a box Q of 7 and a box frequency of 30Hz. The blue, green and red lines correspond to a box volume of 40, 70 and 100 litres respectively.
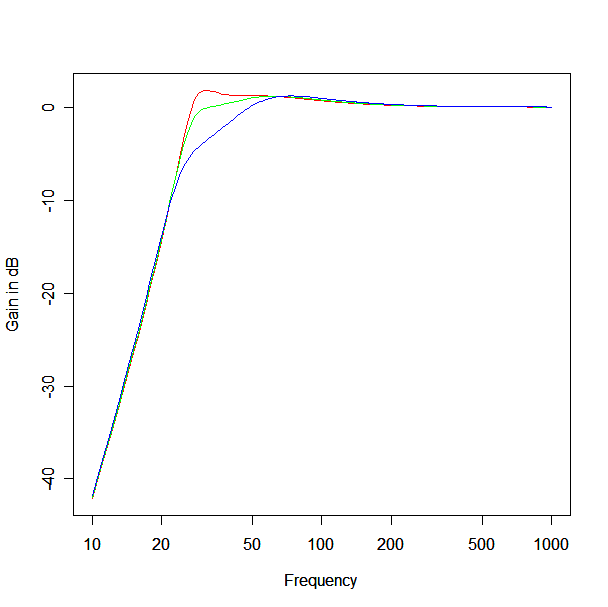
Figure 2 – Vented Box Response for Varying Box Volume : red = 100 litres, green = 70 litres, blue = 40 litres.
Here we see that increasing the box volume gives improved bass extension and a flatter response and a smaller box volume limits the output. A box volume of 40 litres is clearly too small for this driver and box frequency and a box volume of 100 litres will extend the response down to 20 Hz (needing a lower box frequency to remove the peaking). However, 100 litres is a larger enclosure than I’d like and a response to 26Hz is a happy compromise for me, hence the choice of 70 litres for the box volume.
Figure 3 shows the effect of box Q on response with a box volume of 7o litres and a box frequency of 30Hz. The blue, green and red lines correspond to a box Q of 3, 7 and 15 respectively.
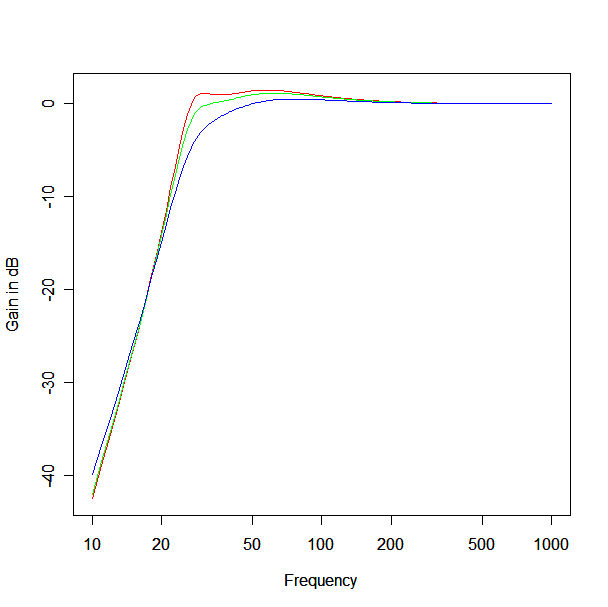
Figure 3 – Vented Box Response for Varying Box Q : red = 15, green = 7, blue = 3.
Here we see that as box Q increases the response becomes flatter and the knee sharper. However, a box Q of 15 is unlikely to be achievable even with all lining removed from the enclosure. There is a significant amount of loss that occurs in the vent itself through the viscosity of the air within it. The only way to reduce those losses is by choice of a large vent diameter (which reduces the volume velocity in the vent) but that has practical limitations because of the longer vent lengths required for larger diameter vents. For these reasons it is unlikely that you can achieve a box Q of better than 10. A Q of 7 is a pretty typical Q figure for most enclosures.
Lower box Q is achievable by loading the cabinet with more damping material (wool / insulation) though it probably isn’t a very good approach because you are effectively reducing the sensitivity of your driver in doing so, dissipating that energy as heat, so if maintaining a reasonable efficiency is desirable then over damping isn’t a good idea.
The vented box parameters for the design are a box volume of 70 litres, a box frequency of 30Hz and a box Q of 7. Having the bass reflex enclosure design nailed down the next issue to contend with is the mid-range driver enclosure and the crossover circuit that divides the signal between the woofer and mid range units. The driver used for the mid range is a VIFA SDS830656 in an acoustic suspension enclosure. The desire is to have a 3rd order crossover between woofer and mid range and to have the mid range unit to act as a woofer mid-range covering the majority of the audio range up to the crossover frequency between mid range and tweeter. By doing so we should obtain a better phase response with most of the phase non-linearity being confined to the spectrum below 200Hz. The sacrifice for this performance is a reduced power handling capacity though the resulting power handling should be more than adequate for my listening purposes.
The woofer-mid-range unit has a second order roll off below the box frequency (acoustic suspension enclosure) and we are after a third order response. We can therefore maximise the range covered by the woofer mid-range and obtain the third order response by using the the second order response of the driver as the second order biquad component of the third order response and obtain the extra component with a simple first order high pass filter. The effective Q require for the second order term (which is provided by the driver in acoustic suspension enclosure) is 1. To obtain a Q of 1 with a box Q of 7 and the driver parameters implies a box frequency, which is also the crossover frequency of around 120Hz. This realises a third order Butterworth high pass response. For the woofer we require a third order low pass filter to compliment it. If we construct such a system and combined the responses we obtain the response of Figure 4. The red plot is the woofer output, the green plot the woofer-mid-range output and the blue the combination of the two.
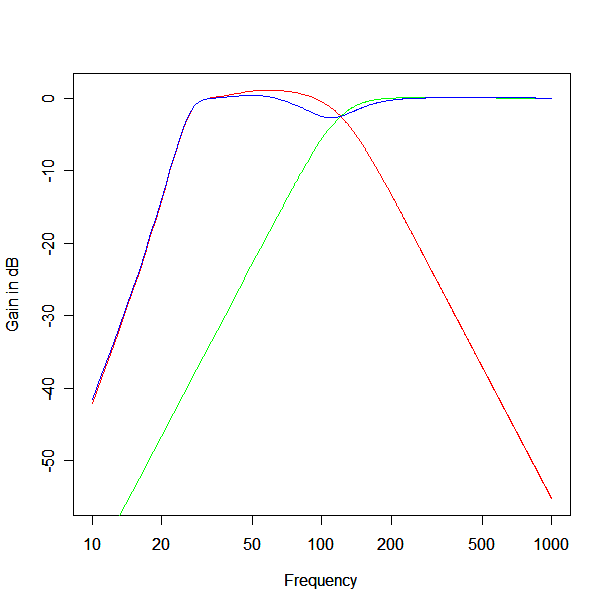
Figure 4 – Prototype Woofer / Mid-range crossover response : red – woofer output, green – mid-range output and blue the combined output.
In normal circumstances third order Butterworth high and low pass filters sum to produce a flat magnitude response. In this case we have a dip at the crossover frequency of around 3 dB. This anomaly arises because of the phase response of the woofer in the crossover region which in turn is influenced by the proximity of the crossover frequency to the modes of oscillation of the bass reflex enclosure. This you can see in the steepness of the phase response for the woofer as shown in Figure 5.
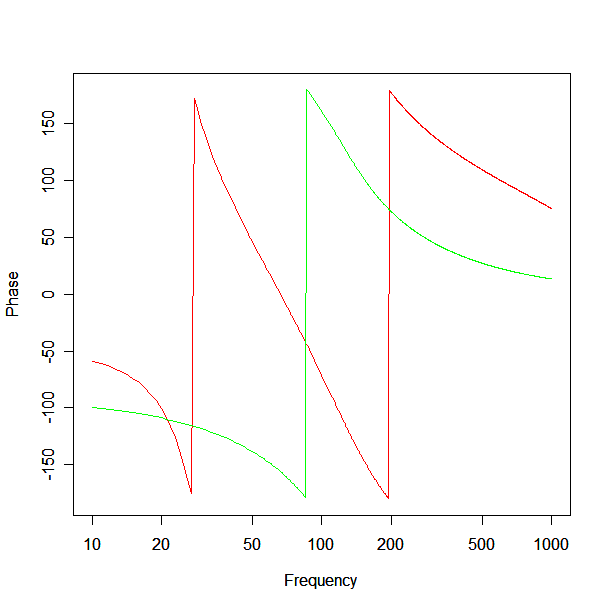
Figure 5 – Prototype Woofer / Mid-range driver phase responses : red – woofer output and green – mid-range output.
This might appear to be a problem but if we relax the constraints on the crossover to be third order but not strictly Butterworth then we can numerically optimise the design to obtain the flattest possible response. This is achieved in R by employing the nlminb() minimizer and defining a suitable cost function to achieve the desired aim, the result of which is shown in Figure 6. Here we clearly see the benefit of such an approach as the combined response is almost ruler flat, removing the hole at the crossover frequency and flattening the peak in the woofer response whilst still maintaining a third order cutoff characteristic.
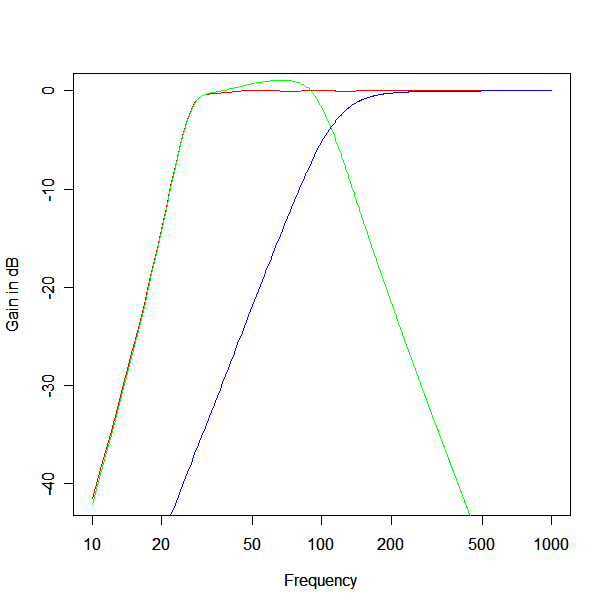
Figure 6 – Optimised Woofer / Mid-range crossover response : green – woofer output, blue – mid-range output and red combined output.
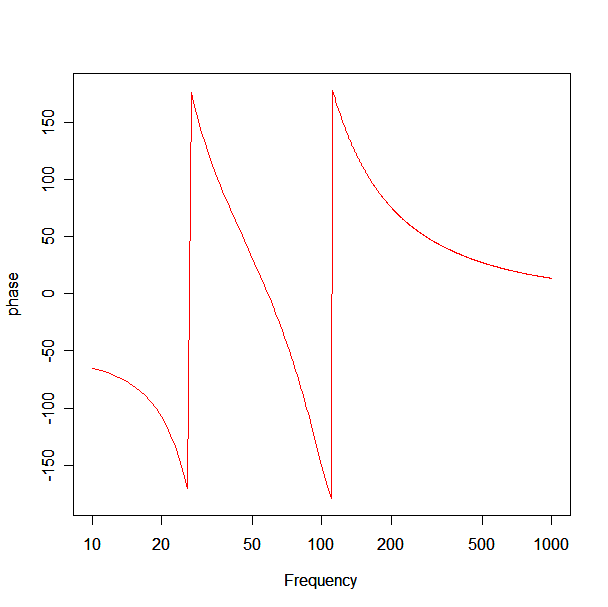
Figure 7 – Optimised Woofer / Mid-range crossover phase response.
The required box volume for the mid-range unit in this realisation is 2.933 litres. Furthermore, the woofer crossover component values are L1=23.5mH, L2=4.23mH and C=388uF (see Figure 8) and the mid-range crossover component value is C = 218uF (see Figure 9).
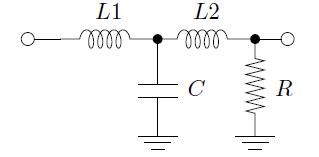
Figure 8 – Third order low pass crossover form. This form is applied to the woofer.
Figure 9 – First order high pass crossover form. This form is applied to the mid-range.
The one problem with this crossover design is that for the crossover behaviour to tally with design behaviour, the load presented to the crossover must be purely resistive but if we look at the impedance of the woofer and mid-range units it clearly is not (See Figure 10).
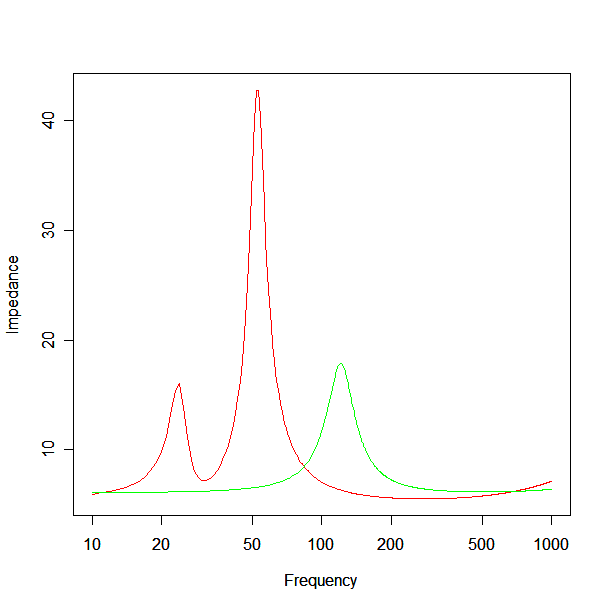
Figure 10 – Woofer and Mid-range driver impedances : red – woofer impedance and green – mid-range impedance.
The woofer impedance has two peaks corresponding to the two modes of oscillation of a bass reflex enclosure : vent and driver in-phase and vent and driver anti-phase. The mid-range unit has only a single peak corresponding to the driver resonance in cabinet. There is also a rising impedance at the high frequency end for both which is due to the leakage inductance of the voice coils of either driver.
If we are to realise the desired response we must equalise the impedance of the drivers so that they both present resistive loads to the crossover. Again if we use numerical optimisation in R we can find the ideal equaliser for each case. Figure 11 shows the impedance of the mid-range unit before and after equalisation.
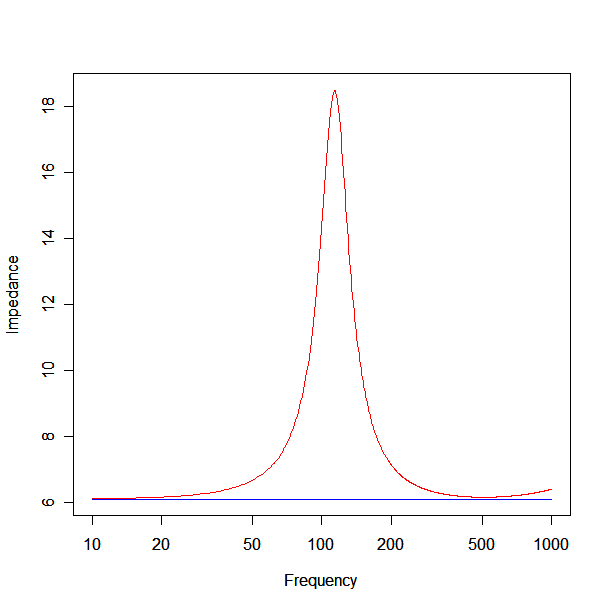
Figure 11 – Impedance of mid-range unit with and without equalisation.
The equaliser has transformed the complex load into a resistive one. The component values needed to realise the mid-range impedance equaliser (see Figure 12) are R=6.1, Ce=9.94uF, Rc=3.0, Lc=14.9mH and Cc=131uF.
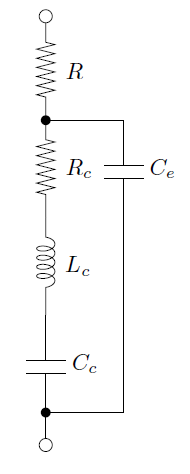
Figure 12 – Impedance equaliser form for mid-range unit.
Similarly, using numerical optimisation we find the equaliser responses for the woofer as shown in Figure 13. Here we have three plots : the red plot is the driver impedance of the woofer, the blue plot is the driver impedance after equalisation and the green plot is the impedance equalisation without the lower series resonator. The reason for showing the later is because the inductor required for the lower series resonator is larger than the inductors commercially available so is, in practical terms, not realisable.
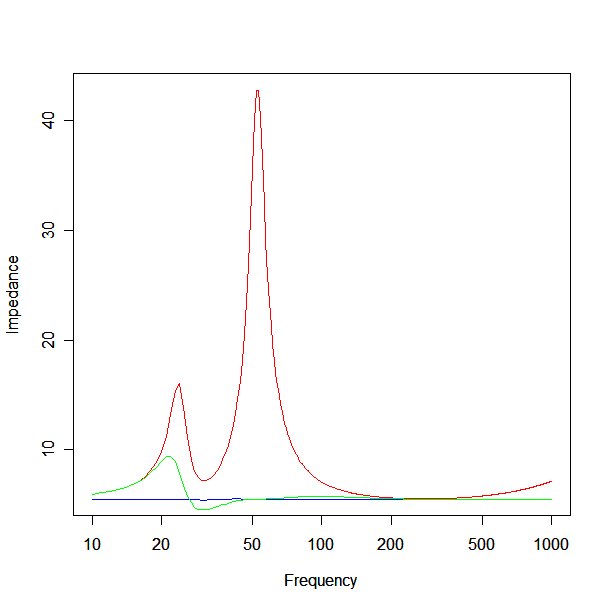
Figure 13 – Impedance of Woofer unit with and without equalisation : red – woofer impedance, blue – woofer equalised impedance and green – woofer impedance equalised without the lower series resonator.
Again, the equaliser has transformed the complex load into a resistive one. The component values needed to realise the woofer impedance equaliser (see Figure 14) are R=5.5, Ce=25.8uF, Rc1=2.91, Lc1=118.8mH, Cc1=372uF, Rc2=0.806, Lc2=16.9mH and Cc2=174uF.
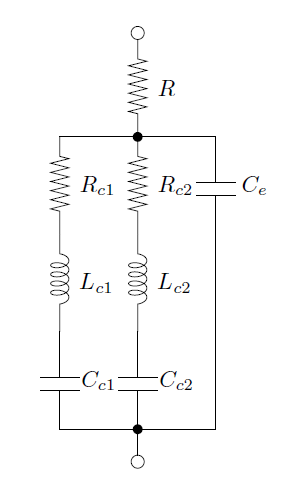
Figure 14 – Impedance equaliser form for woofer unit.
In summary, we are able to obtain a low frequency cutoff of around 26Hz with a box volume of 70 litres and a box frequency of 30Hz. We can also obtain a near ruler flat transition from woofer to mid-range unit using an optimised third order crossover with impedance equalisers on both drivers. With real component values (remember we are limited to the component values available) the reality will not be quite as good though how degraded is not clear at this stage. This will be the subject of my next post on this loudspeaker design.
To be continued…