Manual
Introducing the Limiter
The Har-Bal limiter is in effect nine limiters in one and is constructed in such a fashion in an attempt to minimize intermodulation distortion caused by limiting. It is comprised of three identical limiters but each one of those is a composite limiter comprising three basic limiter building blocks.
The basic limiter building block is represented schematically below and comprises some components found in typically all limiter implementations. The input signal is fed in to a rectifier and a delay line to implement look ahead compensation. The rectified signal is fed to a attack decay processor to realize a “jaggered” envelope estimate. This envelope estimate is further fed through a fourth order Bessel low pass filter to smooth it and is then applied to a divider to realize the limiting. The presence of the Bessel filter helps to reduce the intermodulation distortion resulting from limiting. The delay is automatically chosen to result in the detected envelope time aligning with the actual signal envelope.
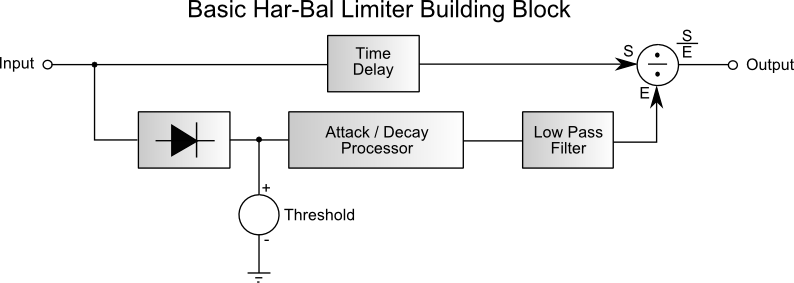
Basic Har-Bal Limiter Building Block
The basic Har-Bal limiter is further comprised of three such limiters in series with different thresholds and attack / decay characteristics as is illustrated below. The first limiter is a slow limiter and provides gross limiting but with some faster transient material exceeding the desired out ceiling for the limiter. The following fast limiter operates with shorter attack and decay times and clamps down on the missed transients in the first stage but some very short transients may still exceed our desired out ceiling. The final limiter is a catch all which guarantees none of the content exceeds the desired out ceiling. This approach to limiting gives rise to less overall distortion because the gross limiting is handled relatively slowly and the missed limiting, which there is much less of, happens quickly and represents a small proportion of the overall limiting within the time line.
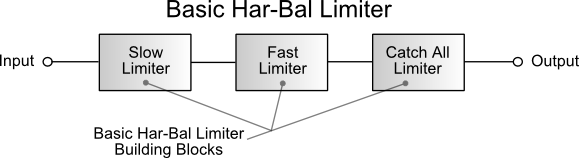
Basic Har-Bal Limiter
Whilst this limiting strategy works well for a lot of content, if the content has a lot of loud bass notes a common problem can arise whereby the limiting of the loud bass creates an obvious pumping of levels in the higher frequency content, resulting in a limiting result that is audibly unsatisfactory. To combat this bass driven intermodulation the Har-Bal Limiter uses a split band approach of breaking the input signal into the bass components (less than 400Hz) and the remainder, with each limited individually and then re-combined post limiting. However, it is not enough to only have two limiters because the limited signals will likely exceed the outceiling when re-combined, so a final limiter stage is employed as a catch all. This gives rise to the limiter structure as illustrated below. Note that all limiters have the same attack and decay characteristics to minimize spectrum distortion. Note also that as the high frequency content is derived by differencing the full signal and the low frequency filtered content, in the presence of no limiting the two streams will recombine perfectly to give the original signal without frequency response or phase distortions.
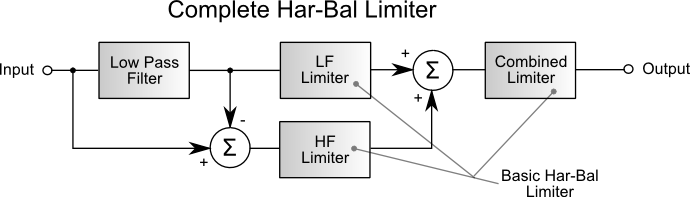
Basic Har-Bal Limiter
This design approach results in a limiter that has minimal artefacts when operated conservatively. Even when driven hard the limiter has a relatively clean sound because of the envelope smoothing, and that is by design. This limit will not crush a signal to the degree of some competative products but that is also by design because in our view, such signal crushing is a bad idea and should never be the default practice of any recorder music production process. The only exception would be deliberately introducing some sort of distortion as an effect, which is not the purpose of this plugin. If a super loud final output is desired then appropriate levels of compression should be included, and not limiting alone. To realise very loud recordings with limiting alone will generally result in unpleasant dynamics inversions whereby the loud passages sound small and hollow, and the quiet passages sound loud and bold. This outcome generally robs the music of its emotional expression and should definitely be avoided.
Finally, it should be noted that the envelope detection within each limiter component utilizes four times over-sampling / interpolation to minimise the likelihood of digital overs. For a technical discussion on the inter-sample over minimisation aspect to the limiter design refer to the article Removing Inter-sample Overs from the Har-Bal Limiter.
Control Panel Overview
The control panel for Har-Bal Limiter is shown below and comprises the following controls:
1 – Gain
This parameter controls the Gain in dB applied to the input signal of the Limiter and is used to bring the signal level up to the limiting threshold. This parameter is automatable.
2 – Ceiling
This parameter controls the limiter Ceiling in dB and corresponds to the basic threshold of the limiter but the limited signal can exceed this level by a small amount owing to how the limiter works (it implements a smooth gain control signal to clamp down on the signal level, which in turn requires some degree of exceeding the ceiling to allow smoothness). This parameter is automatable.
3 – Bypass
This parameter toggles between the limiter limiting the input signal and not limiting it. In Bypass the signal is still passed to the limiter to ensure a glitchless transfer when it is re-engaged. This parameter is automatable.
4 – Average Time
This parameter controls the time constant in seconds for the averaging used to build the time changing histogram estimate of the peak and RMS signal (including the effect of input Gain) and is displayed as the Histogram Graph in item 6. This parameter has no audible effect but controls the rate of change of the histogram estimates.
5 – Low Limit
This parameter controls the lower x-axis limit in dB of the Histogram Graph and allows you to alter the visible dynamic range of the histogram. This parameter has no audible effect but only controls the presentation of the histogram estimates.
6 – Histogram Graph
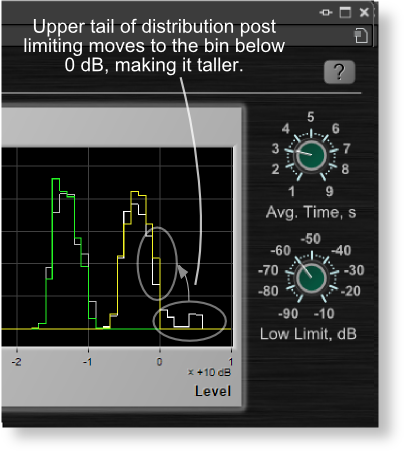
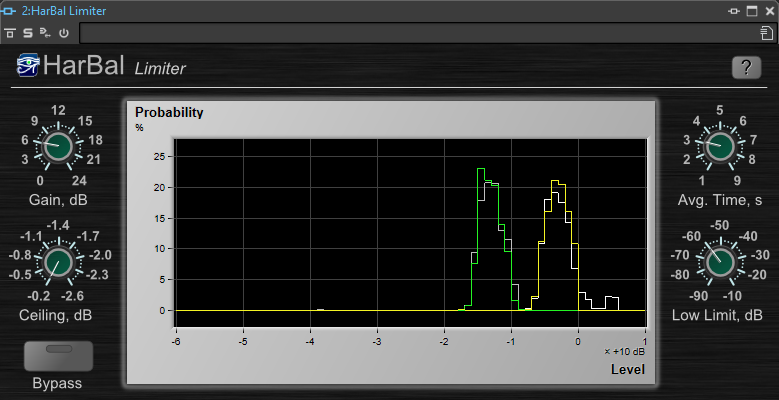
This graph displays the Histogram estimates for the input signal (including applied gain). It displays four plots: the green plot corresponds to the RMS signal histogram estimate with limiting; the dark grey plot corresponds to the RMS signal histogram estimate without limiting; the yellow plot corresponds to the Peak signal histogram estimate with limiting; and the light grey plot corresponds to the Peak signal histogram estimate without limiting. This graph will give a clear indication of how much limiting is occuring and how the signal envelope is being altered by limiting. When limiting occurs the light grey plot will show significant peak signal content above 0dB (in x-axis) and the yellow plot will grow in amplitude (the y-axis) in bins just below 0dB because of the limiting. As an analogy think of visualising a VU meter when it is pushed into hard and constant limiting. In such circumstances the VU meter is fully lit most of the time. As you lower the level the meter reaches near 0dB less frequently. As the gain is increased and more of the input signal distribution is pushed to levels above 0dB the output signal distribution becomes increasingly distorted by excessive limiting. The output distribution bin that includes the ceiling level then becomes a good indication of when too much limiting is being applied. When that bin grows a lot higher than the remainder of the distribution to its left it is a good indication of too much limiting. If the signal level does not reach your desired target with conservative limiting then it is an indication that more compression prior to the limiter is required. This is generally visible from the width of the distribution, both peak and average. If it is wide then application of compression will narrow it and result in a correspondingly louder recording without creating dynamic inversions.
7 – Help
This button opens the help documentation for this plugin.
Control Panel Overview for Har-Bal Limiter
Using Har-Bal Limiter
When inserted as an effect in your master bus Har-Bal Limiter works well as a final stage limiter. When you begin playing your recorded content the histogram plots (6) will start updating. How fast the estimate will move with the music content is gonverned by the average time (4). The default of 3 seconds is useful for most contemporary music as it gives a reasonable estimate with a fairly quick response to changing statistics. On slower moving content such as symphonic works it might be worthwhile using a longer average time.
By observing the right hand tail of the peak power (yellow plot) histogram we can judge how much make up gain (1) should be applied. When the tail is below 0 dB then we have headroom to allow the signal level to grow. Generally speaking we want to raise the gain level so that most of the extended tail of the distribution (the right hand part that flattens out) is collapsed into the upper most bin just under 0dB (see below). That bin should generally be active no more than 20-25% of the time (ie. the level of that bin should be below 25%). If it exceeds that level then you are likely heavily over-limiting you track.
One final note. Ideally the input and output distributions (coloured and grey plots) should overlay one another when no limiting is occuring. Because of the latency of the limiter (the time delay introduced into the signal path to make the detected envelope align in time with the signal), the samples used to calculate the input distribution are different to those on the output distribution, and this leads to the input and output distributions not matching. They do, however, reflect the same general statistic to the extent needed in this application. A more involved implementation could account for this but for simplicity sake this was not done.